HOME > PC > SSD vs. HDD > SandForce > en
Benchmarks of SandForce based SSD's
SSDs with SandForce controller came with G-Monster2 SFV1 in January, 2010, retail price being far beyond my reach. In May, 2010, Vertex 2 from OCZ came with affordable price with extraordinary specifications like max performance read up to 285MB/s and max performance write up to 275MB/s. This is proven by the ATTO Disk Benchmark test results and the results are mostly compatible with the HD Tune Pro results.
"Pssd = Pnand x Nch"
where Pssd=maximum performance of sequential write on SSD, Pnand=maximum performance of sequential write on a single NAND flash chip and Nch=number of the channels processed simultaneously by the device controller.
Although maximum performance is limited by the physical constructure of the SSD as shown above, there are some ways to let the SSD work better.
When we had been using JMF602 controller, small data such as 4 KB is written in a block of 512KB in size. For writing down a small data, you had needed to erase a big block, and this had led to decreased performance of "Random Write 4KB". If you collect the small size data and write them down on a single block altogether, you can recover the decreased speed closer back to where it was before. By lowering the "write amplification", the performances of SSDs get greater and this is functioning well with Intel X25-M and Toshiba SSD.
The second way to let the SSD to perform better is the introduction of cache.
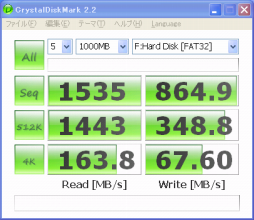
Hardware-wise, DRAM cache is installed in SSDs with Indilinx controllers and those with JMF612 controllers. You may also install SSDs on RAID cards with a big cache like Areca ARC-1231ML and may get a tremendous score like this.
Software-wise, IDE devices may use the system RAM as their own write cache introducing the Petite Freeze Buster driver, or installing the software applications such as FlashFire and Mach-Drive may boost up the drive's bench scores.
Hard-and-Software-wise, SATA drives may be connected to the system with the AHCI mode and you may enhance the bench scores of Random 4KB QD32 using the system RAM. NCQ compatible X25-M G2 works well with IMSM (Intel Matrix Storage Manager) or IRST (Intel Rapid Storage Technology Driver) in this way.
The third way to increase the performances of SSDs is to remove or widen the interface bottleneck. RealSSD C300 is the first SSD to use the SATA 6Gbps interface.
Compressed data can be written faster into the drive when the data is compressible, and not the case when they are not. SandForce SSD controller is the first one to compress the data when writing and thus achieving a better performance.
I was intrested in how the compression system works and took the benchmarks of the SandForce controlled 50GB Vertex 2 on June 5, 2010.
BENCHMARKS
Specicications of the initial system are:
PERFORMANCE MEASUREMENTS 1
First, the SSD is formatted with NTFS file system, and the Vertex 2 drive is connected to the system through the SATA 3Gbps port in IDE mode. The benchmarks are taken using the CrystalDiskMark 3.0 Alpha3, the testing size being Fig.1a 100MB and Fig.1b 1000MB respectively.
Fig.1a 100MB 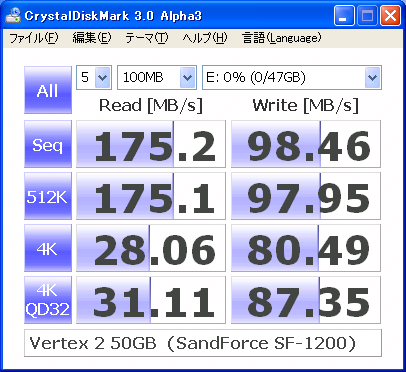 Fig.1b 1000MB
CrystalDiskMark 3.0 Alpha3 100MB test score:
Sequential Read was 175.2MB/s and Sequential Write was 98.46MB/s.
CrystalDiskMark 3.0 Alpha3 1000MB test score:
Sequential Read was 171.8MB/s and Sequential Write was 99.47MB/s.
Oh, what a score!
The similar results obtained with AS SSD Benchmark are uploaded on this site.
Another customer is also disappointed at his score. He was claiming that this is almost the same with Indilinx driven SSD.
I had also noticed that Random 4K QD32 data were not fast enough for the NCQ compatible drives.
I had to step forward to go to AHCI or RAID mode SATA connection to enhance the Random 4K QD32 scores.
I had replaced the IDE boot SSD in the first test system with RAID 0 ANS-9010 in the second one.
The second test system is as follows:
PERFORMANCE MEASUREMENTS 2
The Vertex 2 drive is formatted with NTFS file system, and the drive is connected to the system through the SATA 3Gbps port in AHCI (RAID) mode with the IMSM drivers installed. The benchmarks are taken using the CrystalDiskMark 3.0 Alpha3, the testing size being Fig.2a 100MB and Fig.2b 1000MB respectively.
Fig.2a 100MB 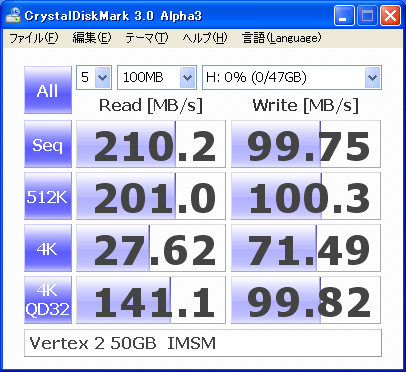 Fig.2b 1000MB
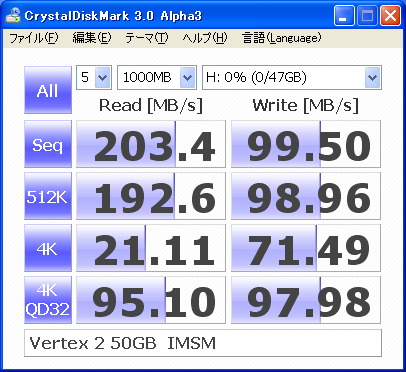
Random 4K QD32 scores rose sharply representing the NCQ cache.
Sequential Write scores are still as low as X25-M.
There is a performance ceiling limit with SandForce SSD when it comes to processing non-compressive random data created by CrystalDiskMark 3.0 Alpha3 because there is a physical limitation on this drive shown in the formula above.
Meanwhile, new version of CrystalDiskMark 3.0.0d has now come with the new feature to create "All 0x00" (0Fill) or "All 0xFF" (1Fill) for measurements!
PERFORMANCE MEASUREMENTS 3
The Vertex 2 drive is formatted with NTFS file system, and the drive is connected to the system through the SATA 3Gbps port in AHCI (RAID) mode with the IMSM drivers installed. The benchmarks of "All 0x00" (0Fill) measurements are taken using the CrystalDiskMark 3.0.0d, the testing size being Fig.2a 100MB and Fig.2b 1000MB respectively.
Fig.3a 100MB  Fig.3b 1000MB
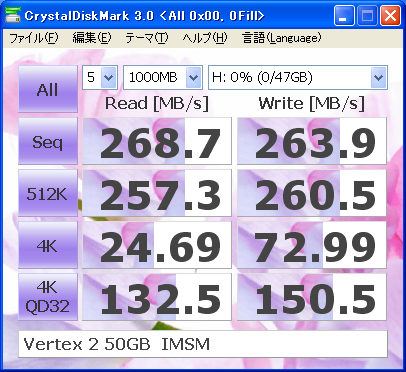
CrystalDiskMark 3.0.0d 100MB test score:
Sequential Read was 269.8MB/s and Sequential Write was 263.5MB/s.
CrystalDiskMark 3.0.0d 1000MB test score:
Sequential Read was 268.7MB/s and Sequential Write was 263.9MB/s.
Wow!
Scores of the Sequential Write sky-rocketed!
The results are as high as announced performance by the manufacturing company.
From this lesson, I have learned that SandForce controlled SSD is actually compressing the 0 filled test data, and "the max performance read up to 285MB/s and max performance write up to 275MB/s" is true.
Let me go further to confirm if there is any difference between the "All 0x00" (0Fill) measurements and the "All 0xFF" (1Fill) measurements.
PERFORMANCE MEASUREMENTS 4
Fig.4a 0Fill  Fig.4b 1Fill
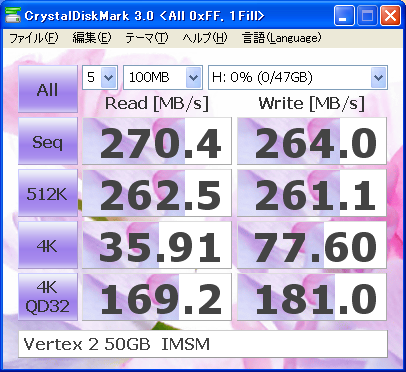
This measurement test ended up with no difference between the two.
REAL-WORLD BEHAVIOR
I had picked up a 4,194,304KB test file from Acronis TrueImage backups and studied how the high performance SandForce SSD would behave when coping and pasting the file in the same drive. SSDs are susceptible when the data for reading and writing are coming across toward the other direction at the same time.
I had measured the time to "copy & paste" a 4,194,304KB file in the same SSD or HDD drive and the results are as follows.
Precise method is described here in Japanese.
JMF602Åi293.67 sec) > HDD(199.94 sec) > Indilinx(156.21 sec) > SandForce(130.63 sec) > Samsung SLC(94.42 sec) > X25-M(72.05 sec) > Toshiba SSD(67.42 sec)
I have learned that Toshiba SSD and X25-M were two times faster when coping an already compressed big file pasting into the same drive, and I could not get any benefit of compressing advantage from the SandForce controlled SSD in this case.
As far as the compression while coping and pasting, early edition of Windows Vista might not have worked as they had designed and there was little or no advantage over XP while compressing and transferring the already well compressed data like mp2, m2ts, flv, jpg, etc.
However, looking at the results of "PERFORMANCE MEASUREMENTS 1", the performance of Random Write 4KB is one and a half times higher with SandForce SSD than that with X25-M, the SandForce based SSD is highly capable of handling small size data, so this is one of the SSDs most suitable for working with Microsoft Office or enjoying browsing the Web.
Lastly, according to BeHardware, TRIM function for the SandForce SSD works perfect with Intel RST drivers (IRST etc.) and there is still to be done with standard Microsoft Windows 7 drivers or drivers for AMD and SATA PCIe cards.
There could also be an incompatibility problem between the standard Microsoft Windows 7 drivers and the SandForce controller drivers in terms of NCQ cache. In Fig.3b of my study, the NCQ cache for both reading and writing is working fine with my old IMSM which came with my motherboard, while in this screen shot in the site of Hermitage Akihabara, just the NCQ cache for reading is functioning all right although that for writing appears disfunctioning with the standard Microsoft Windows 7 drivers coming with the latest technologies.


